


Turn what you know into what your team should do next.
MAP Reach doesn't just capture activity:
it creates a continuous Understand → Prioritize → Improve → Prove operating model.
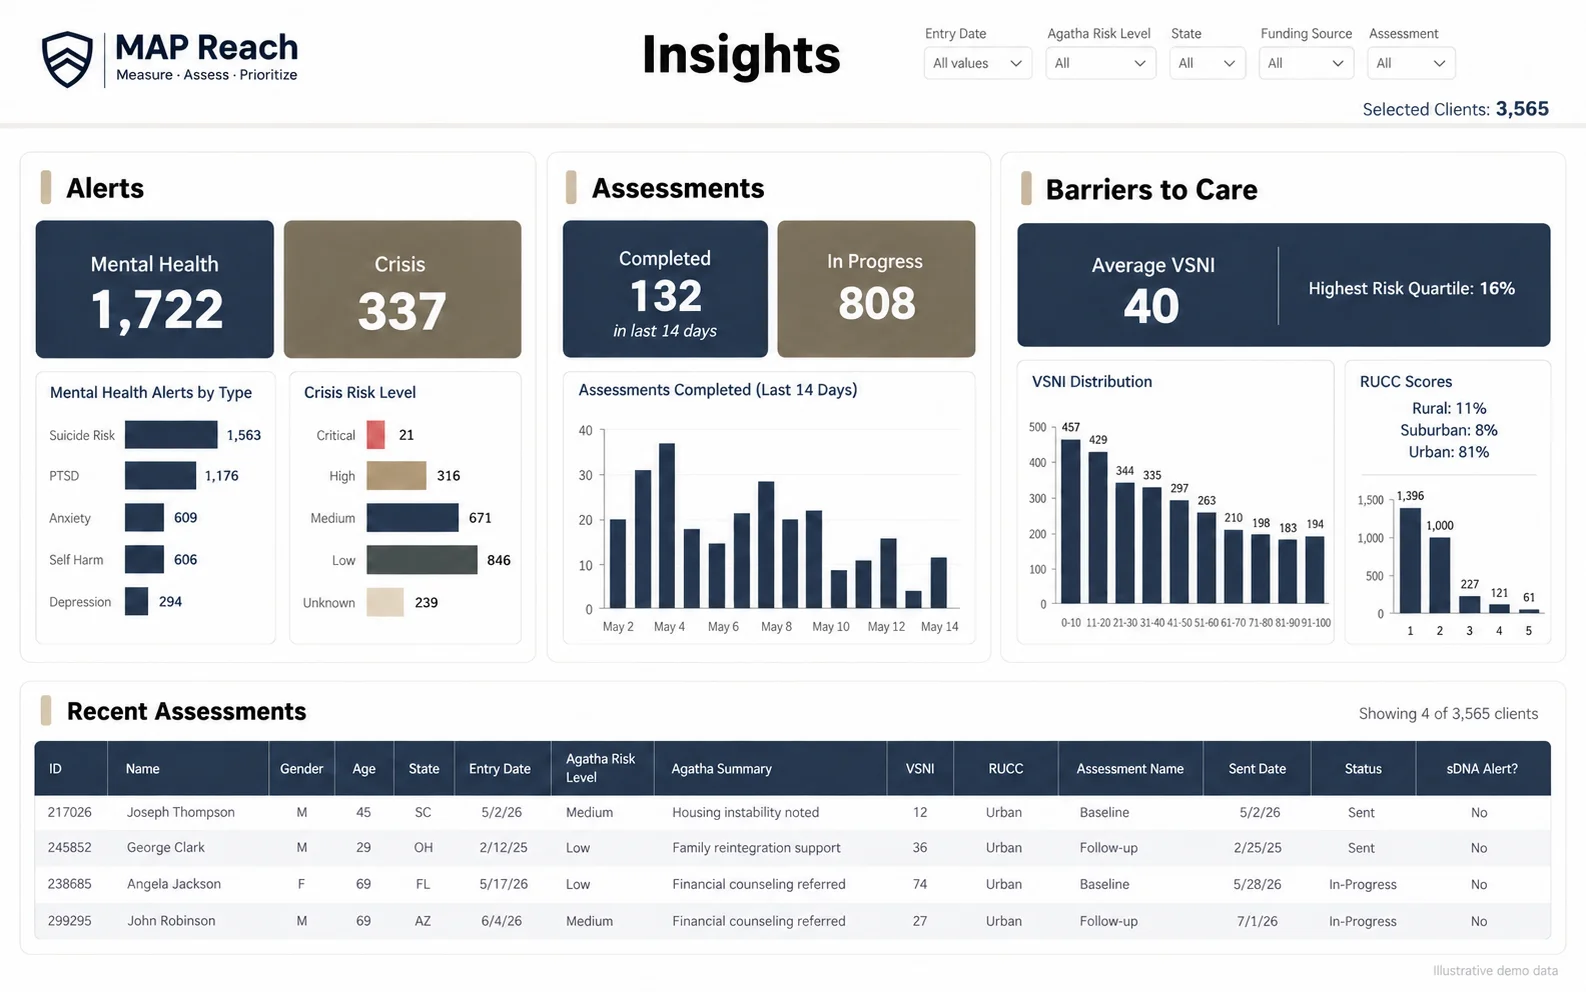
The Operating Model
Four stages. One continuous loop.
Each stage feeds the next — and Prove feeds back into Understand, so every cycle gets sharper.
Understand
Stage 1: Get to know your clients.
Start with population-level social needs and community conditions — before any single client walks through the door.
 Population-level social needs
- Community context powered by Barriers to Care
- Capture individual needs in their own words
- Dynamic tailored assessments
- Delivered by email and/or text message
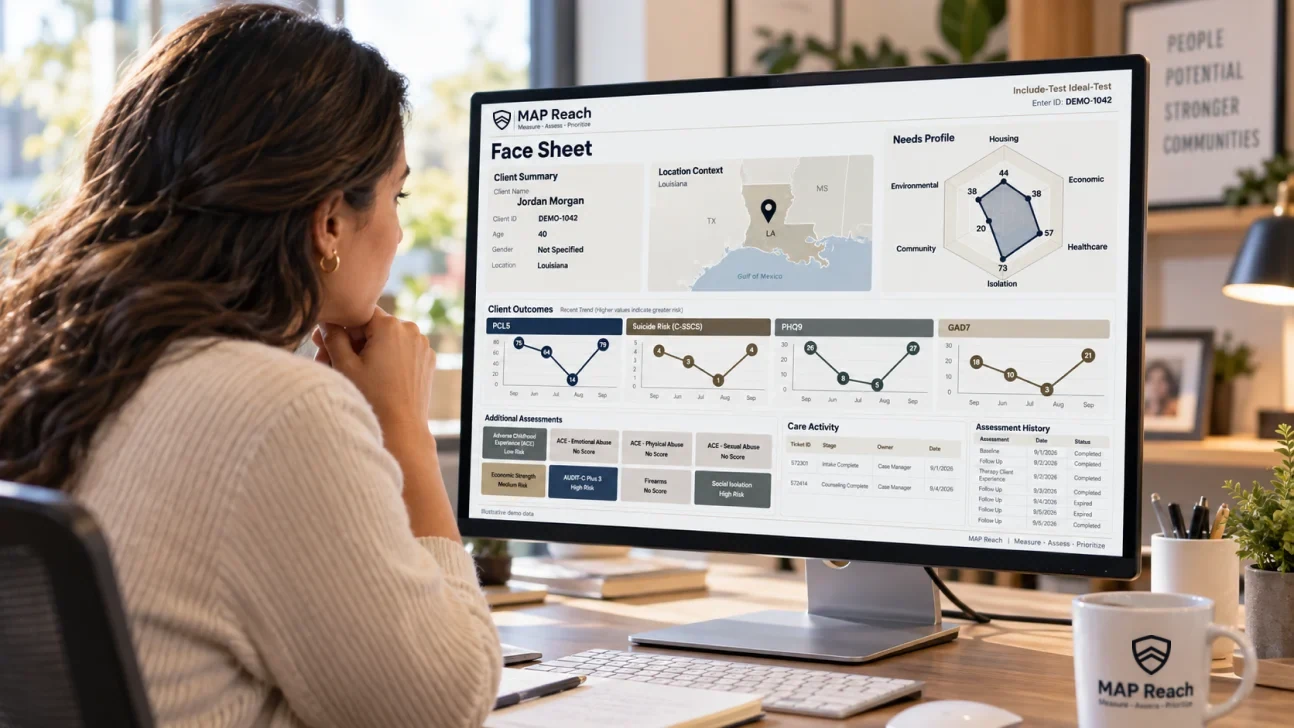
Prioritize
Stage 2: Know who needs attention first.
Bring the population picture down to the individual, combining what people report with the signals in their data to identify where attention is needed most.
- Individual needs and priorities identified
- Dynamic, guided assessments
- Risk and priority signals surfaced
- Powered by sDNA, Face Sheets, and Agatha

Improve
Stage 3: Turn insight into action.
Give staff the information they need to respond sooner, focus on what matters most, and take the right next step for each person.
- Actionable alerts and recommended priorities
- Open-text analysis surfaces needs that may be missed
- Insight routed to the right staff and programs
- Follow-up and response tracked

Prove
Stage 4: Show what changed.
Track what happens after the intervention so you can understand what works, improve programs, and demonstrate measurable impact.
- Outcomes tracked over time
- Needs, actions, and results connected
- Program and population impact measured
- Reporting for leaders, funders, and partners

Next Step
See the full loop, running on your organization's
own use case.
Explore the platform capabilities behind each stage, or book time to see it live.