



Face Sheets
"Who is this person, and what's their story?"
A complete, longitudinal view of one client's needs, risks, and interactions.
Population intelligence, individual assessments, AI-supported signals, alerts, dashboards, and outcomes — working together in one place, alongside the systems you already use.
The Operating Loop
 PrioritizeImproveProve
One continuous loop, not a linear pipeline. Each pass makes the next one sharper.
Build a more complete, longitudinal view of each client’s needs, risks, assessments, interactions, and outcomes.
Build a more complete, longitudinal view of each client’s needs, risks, assessments, interactions, and outcomes.
Why MAP Reach

 Records client activity
 Yes
 Yes
 Turns that activity into action
 NoYes
 Stays current, not reviewed once a cycleNoYes
 Works on top of your existing CRMNoYes
 Prioritizes clients automaticallyNoYes
 AI-supported signals flag risk earlyNoYes
 Built on population-health expertiseNoYes
Platform Overview
Population intelligence and individual assessments feed AI-supported signals and alerts —
surfaced through dashboards, and concluded with outcomes.
 Population IntelligenceBarriers to Care
 Individual AssessmentssDNA
 AI-Supported SignalsAgatha
 AlertsCritical
 Population HealthUnderstand Sub-Populations
 OutcomesClient & Population
The Capabilities
 Population Intelligence
Geographic and population-level insight into the social needs and conditions of the communities you serve.
Geographic & population-level insightsSocial Determinants of Health contextApproved statistics and measures, sourced from EQA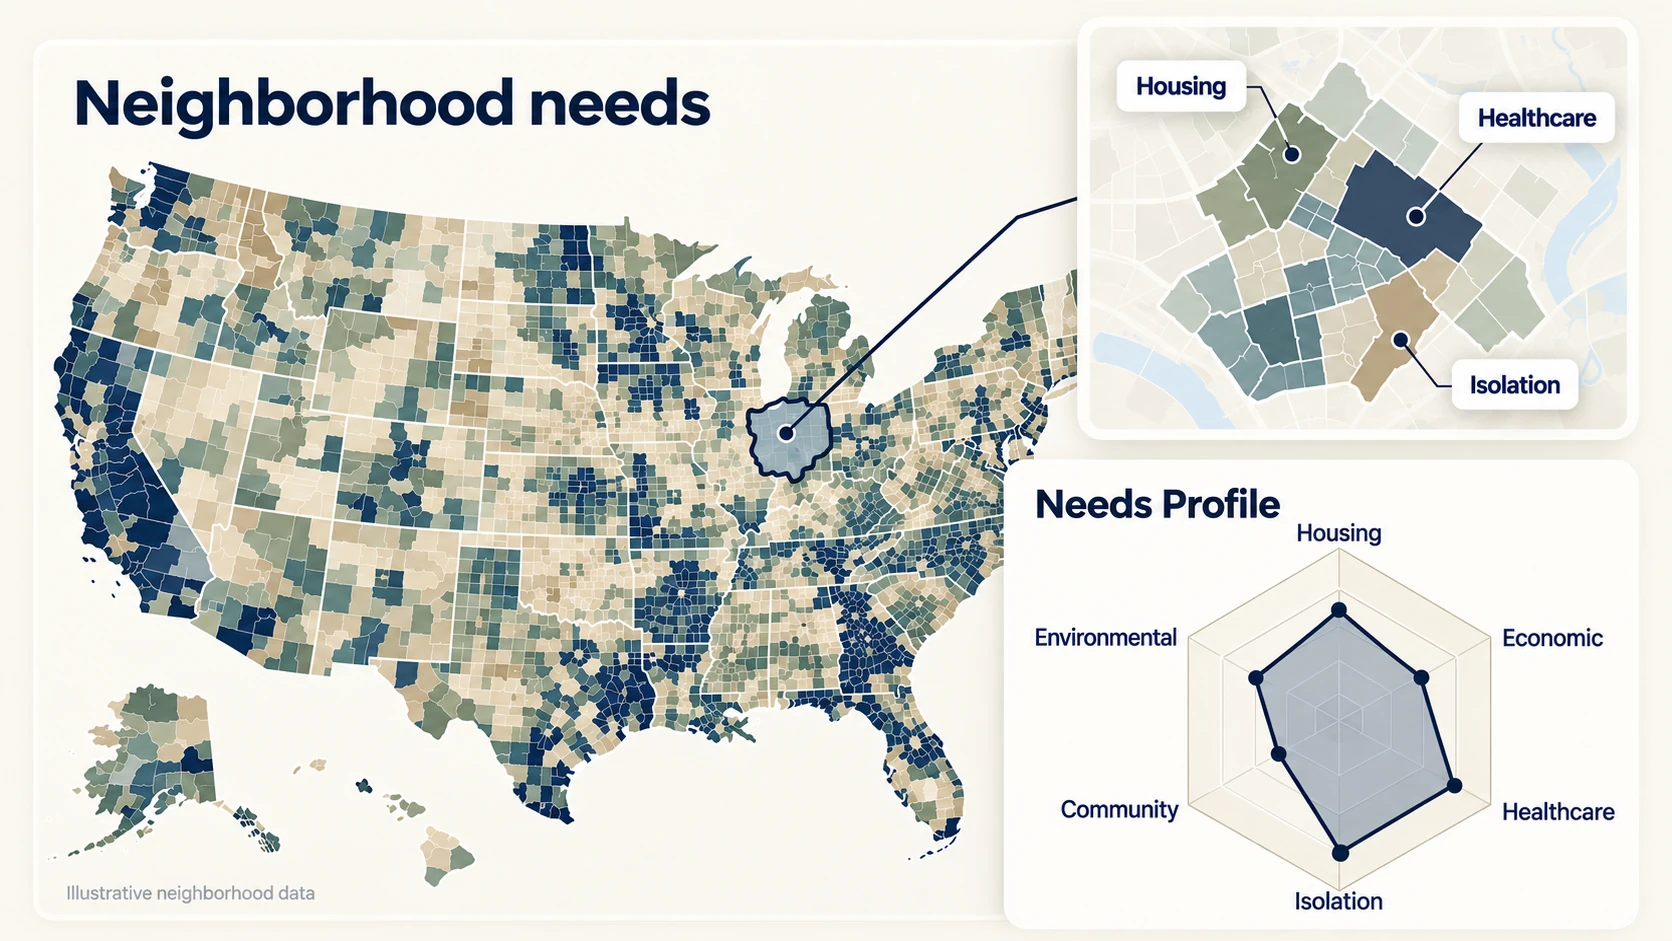
 Tailored Assessments
A guided assessment experience that captures self-reported needs directly from the people you serve.
Individual assessment experienceSelf-reported needs, captured directlyConnected to Face Sheets and broader client context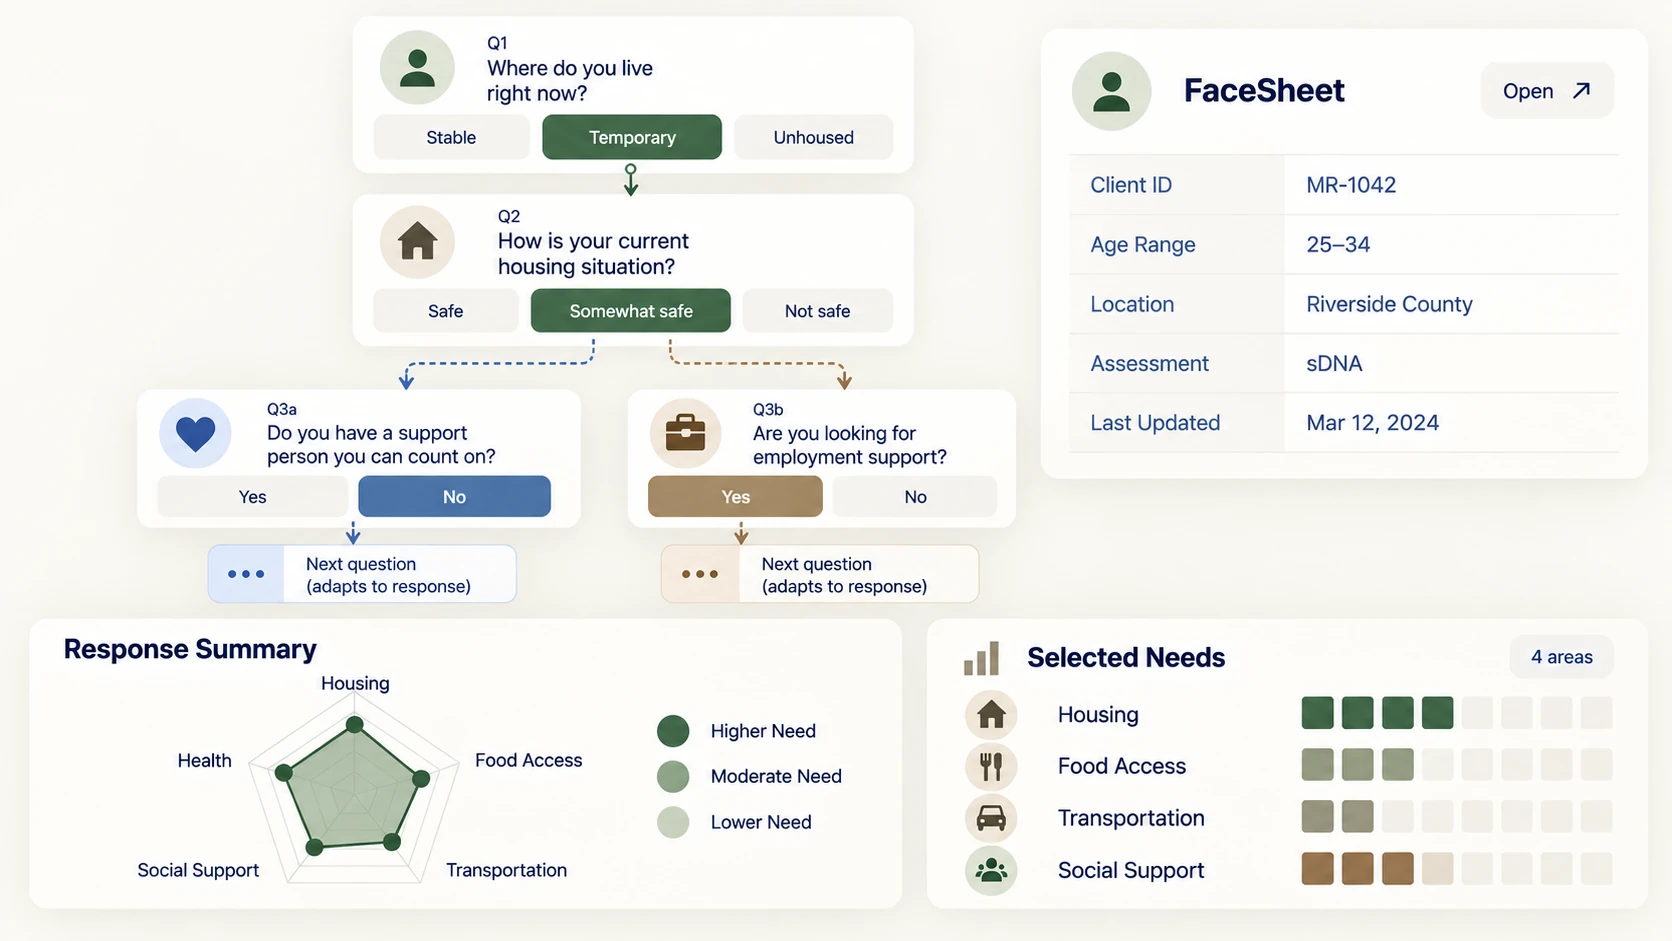
 Population Health
Identify and understand different sub-populations based on demographics, rurality, etc. and compare their health profiles.
Ability to create sub-populations by demographic or geoCompare health profiles across different sub-populationsDevelop new programs to address needs in sub-populations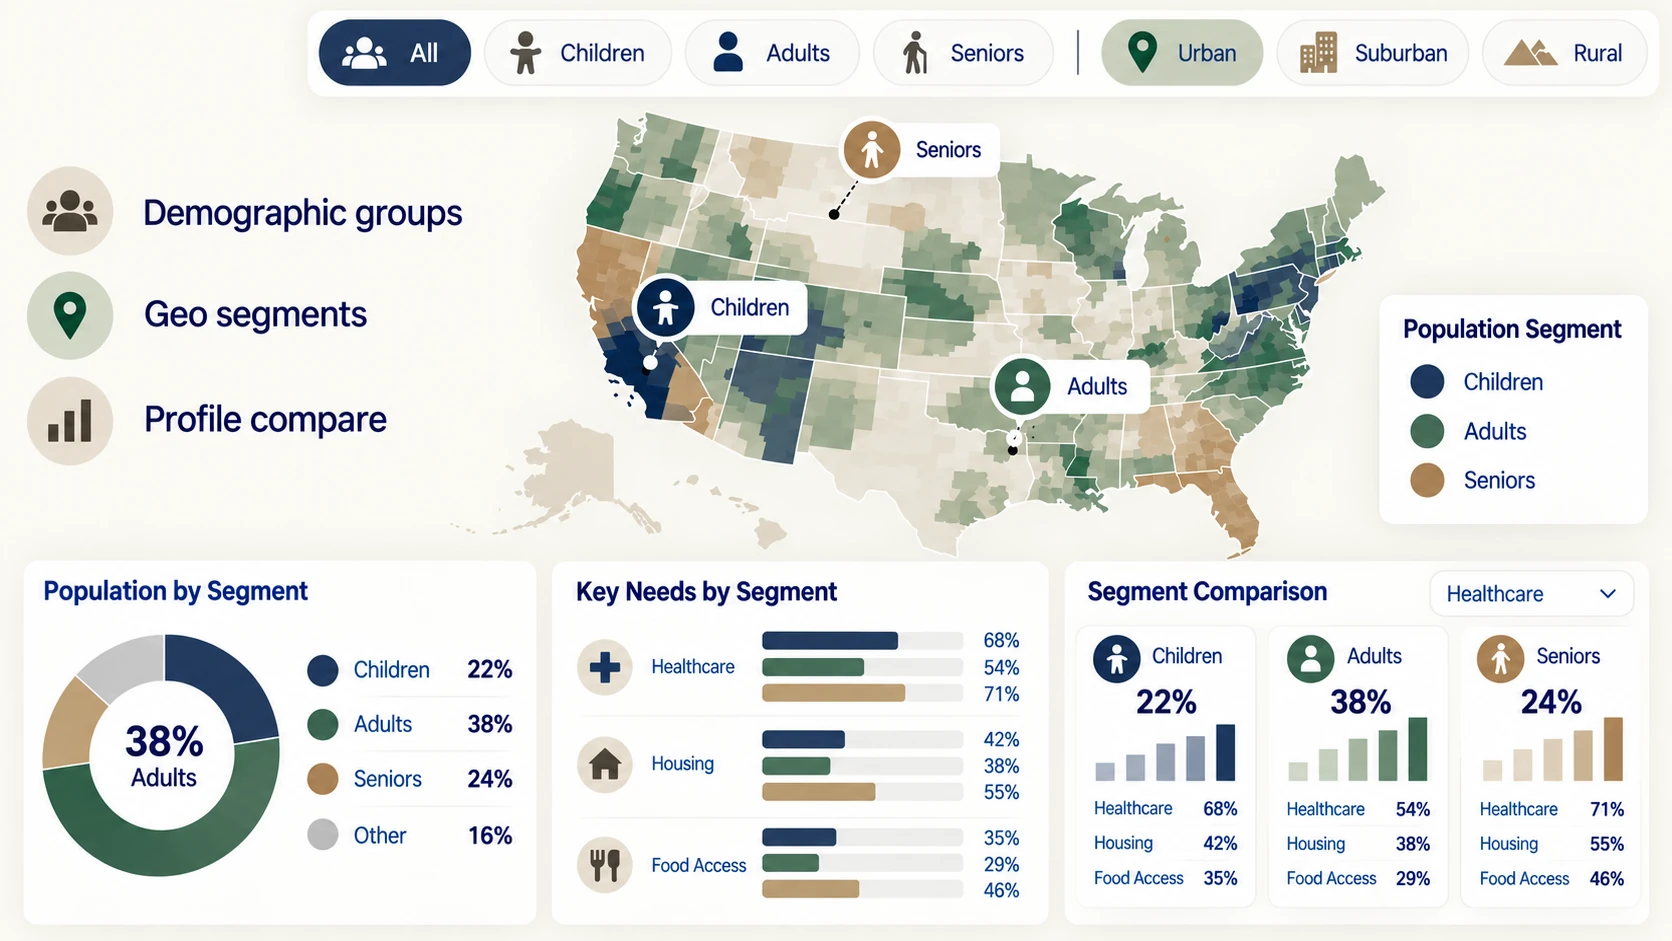
 AI-Supported Signals
AI-supported analysis of open-text information, surfaced for human review rather than automated action.
Analysis of open-text informationSignal identification and synopsisBuilt for human review — staff stay in the loop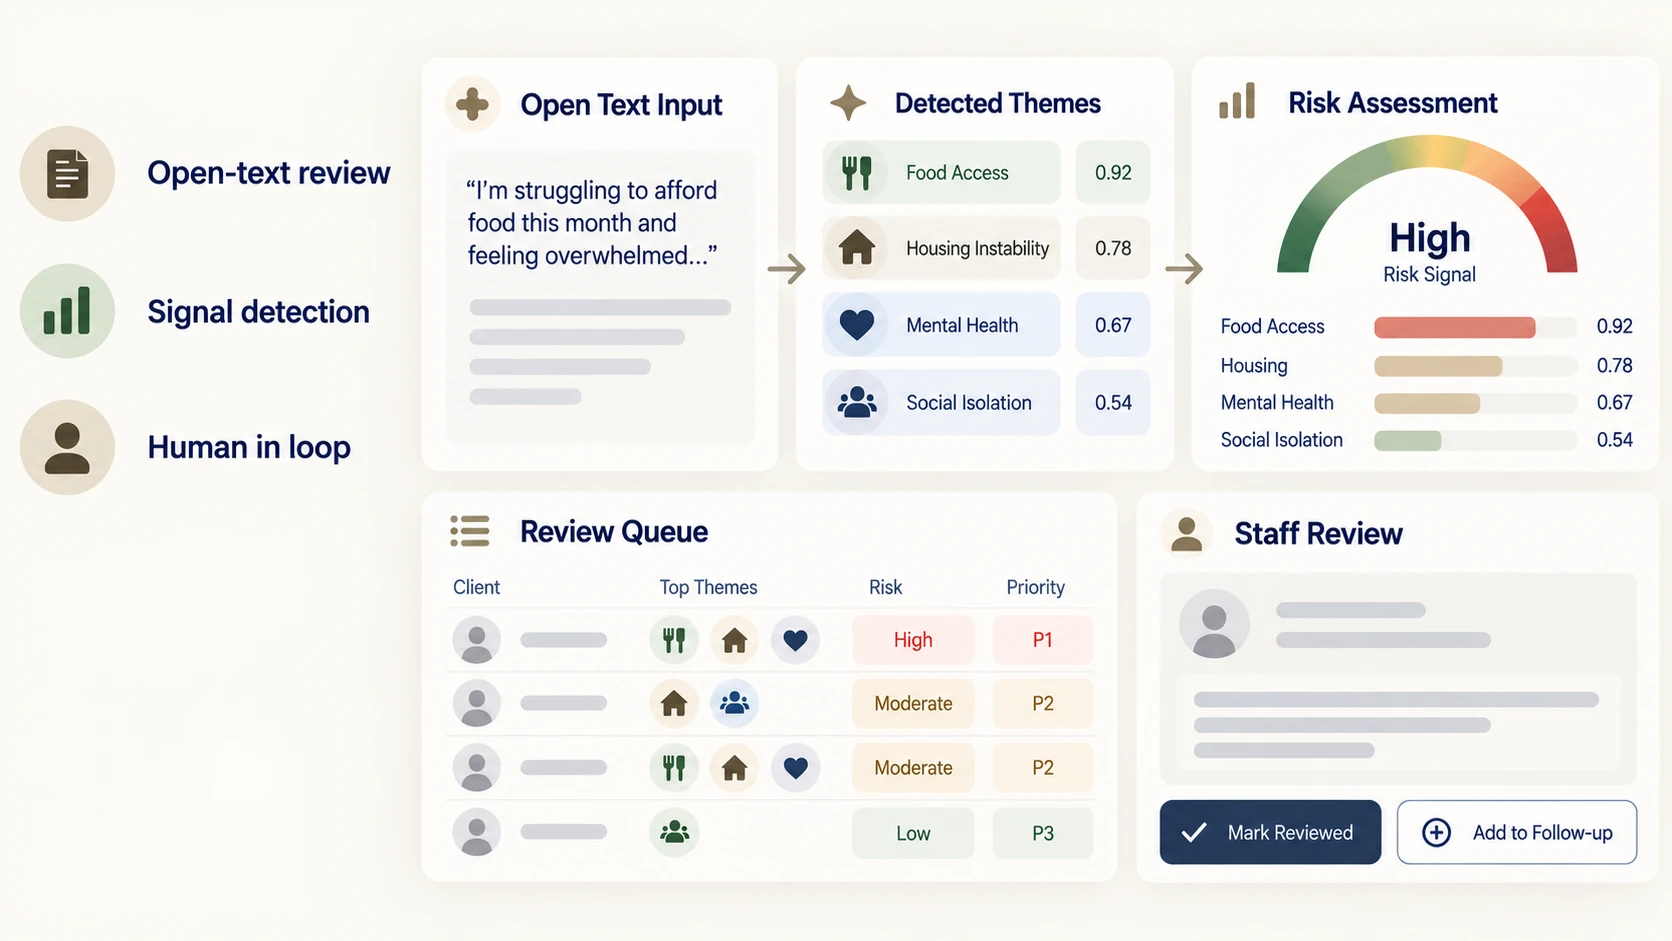
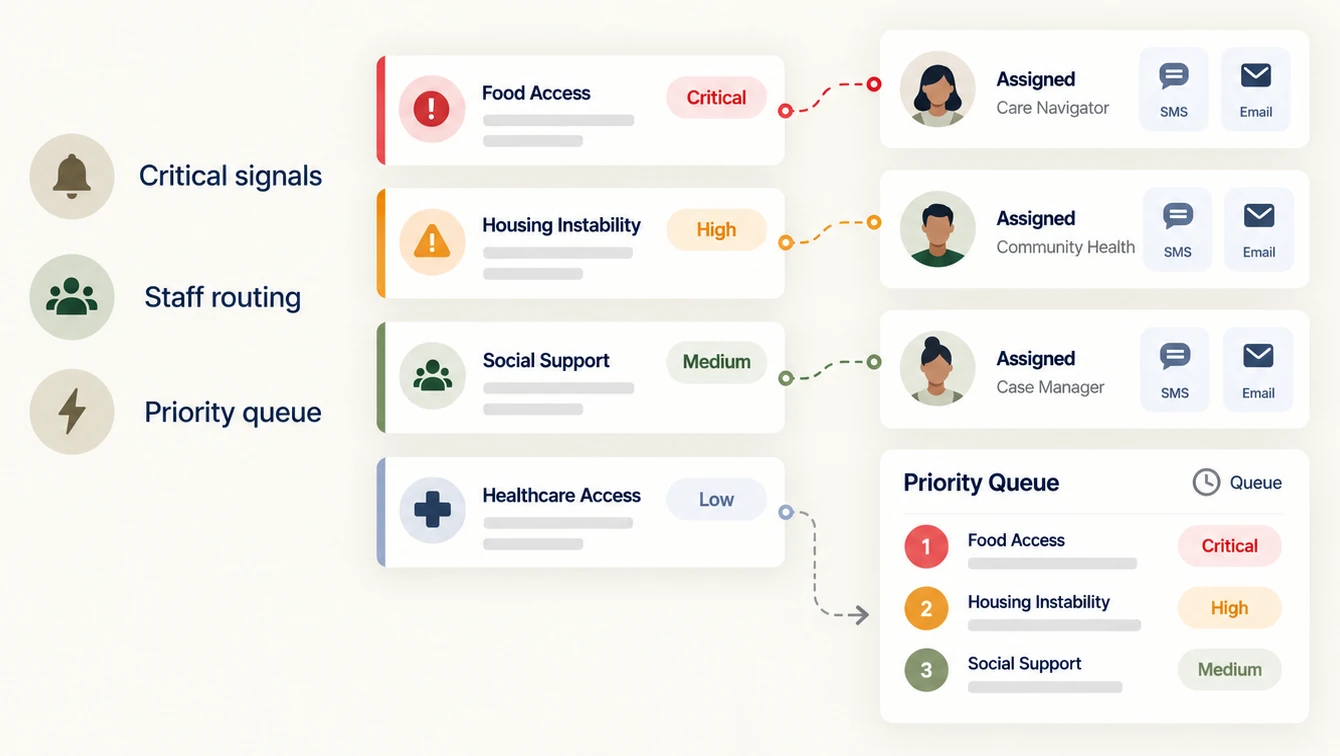
 Alerts
High and critical signals routed directly to the staff who need to see them, when it matters.
High and critical signal detectionNotification of designated staffNothing urgent is lost in the queueNote - MAP Reach is not a crisis or emergency service.
 Outcomes
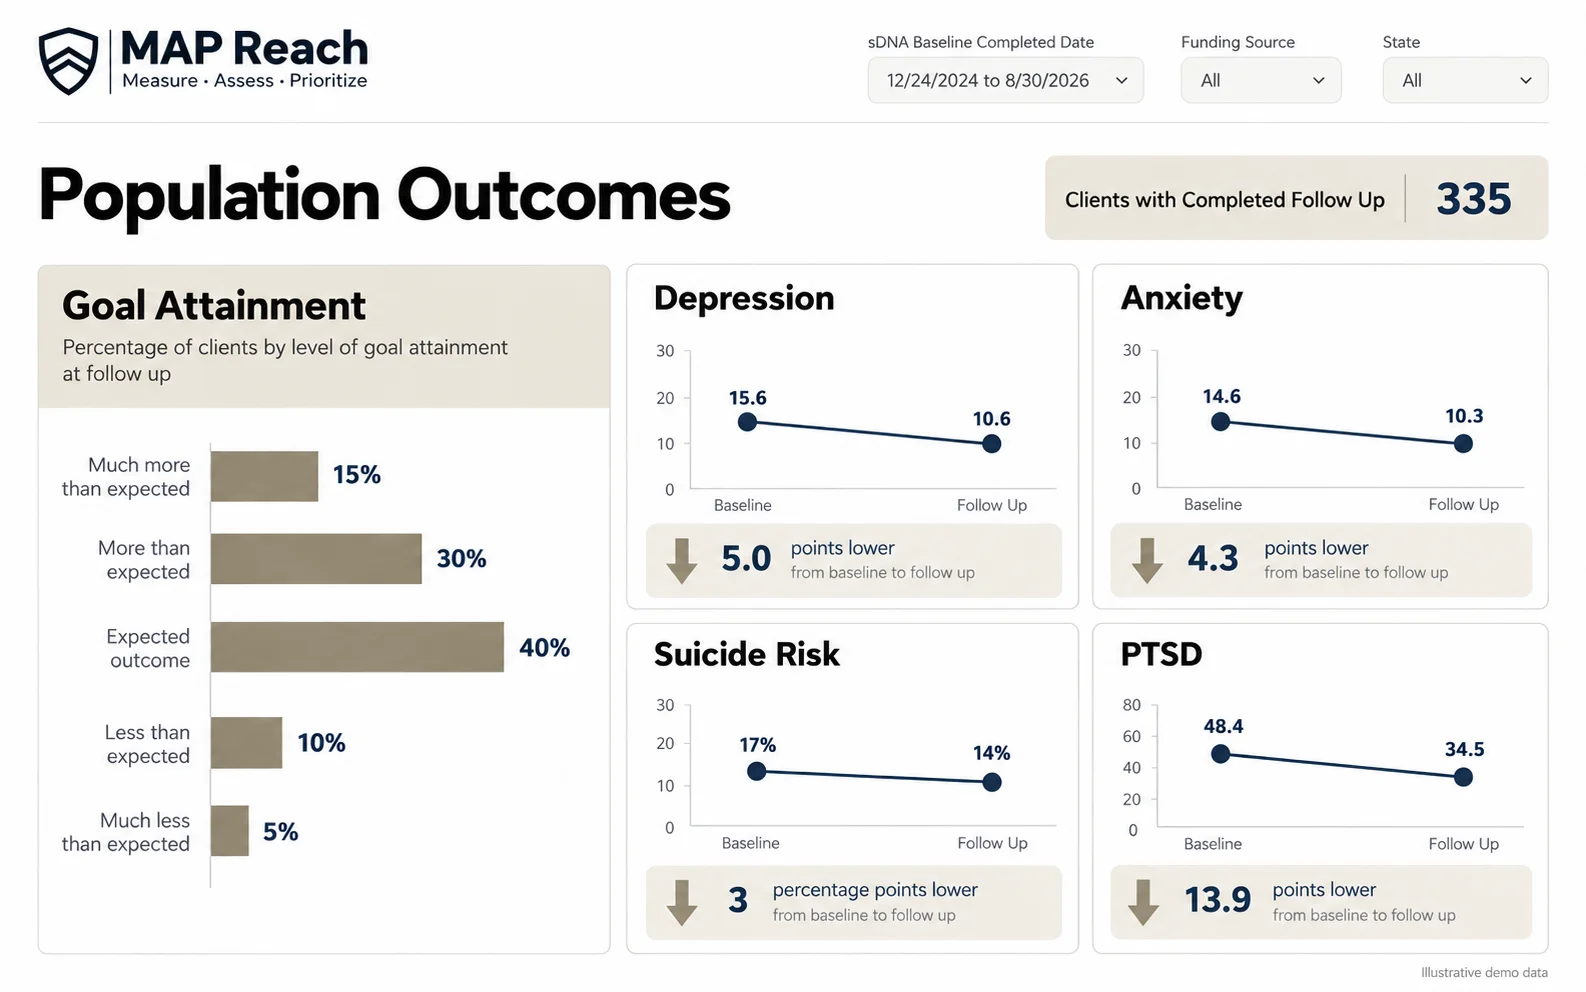
Compare how your clients are doing after receiving your care and measure the impact you’ve had from their perspective.
Client level outcomes comparing baseline against follow-upsPopulation level outcomes with inclusion criteriaClient experience like NPS, CSAT, and direct feedback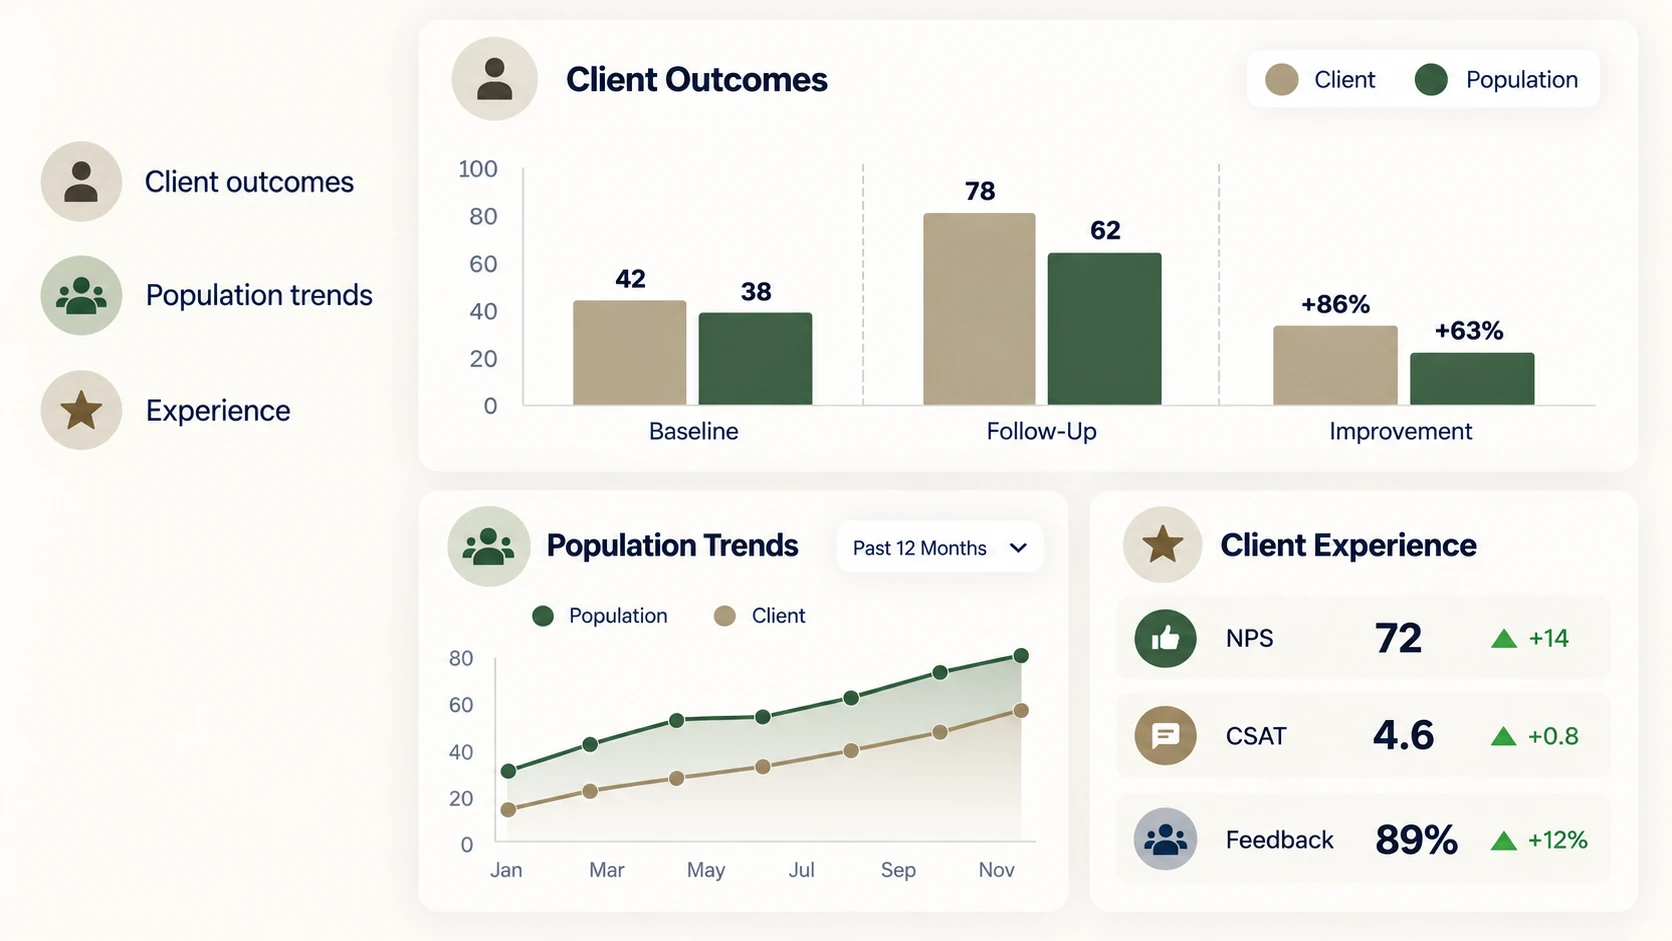
 Dashboards
"Who is this person, and what's their story?"
A complete, longitudinal view of one client's needs, risks, and interactions.

"What's happening across our caseload?"
Patterns, gaps, and signals surfaced across the population you serve.

"Is what we're doing working?"
Outcome measurement at both the individual and population level.

"How do people feel about the help they got?"
NPS, CSAT, and direct feedback, alongside outcome data.
Integrations
MAP Reach is designed to sit next to your CRM or case-management tool, not replace it.
Platforms and tools already in place


 SalesforceHubSpotMicrosoft Dynamics 365

 SnowflakeBigQueryDatabricks


 ServiceNowZendeskJira


 TypeformJotformFormstack
 Epic Clarity
Custom connectors can be built depending on the EHR system.
Assessment, prioritization & outcome intelligence layered on top
Staff and program teams act on what surfaces
 Who needs attention now
 Outcome reports
 Program decisions
See It For Yourself
In 30 minutes, see how MAP Reach could help your team.